Beer's Law Example
A series of standard solutions containing a red dye was made by diluting a stock solution and then measuring the percent transmittance of each solution at 505 nm (greenish blue). This wavelength was selected by examining its absorption spectrum. If the solution looks red, it is absorbing red's complementary color of light, which is greenish blue. The results, after conversion to absorbance, are shown below.
An absorbance of 0.39 was also determined at 505 nm for a solution with an unknown concentration of the red dye.
|
solution |
concentration |
absorbance |
|
|
blank |
0.00 M |
0.00 |
|
|
standard #1 |
0.15 M |
0.24 |
|
|
standard #2 |
0.30 M |
0.50 |
|
|
standard #3 |
0.45 M |
0.72 |
|
|
standard #4 |
0.60 M |
0.99 |
|
|
sample |
???? M |
0.39 |
|
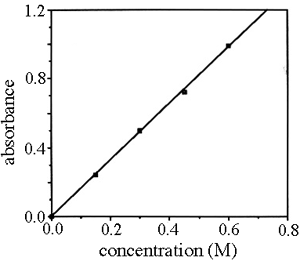
If the absorbance of the blank and standards are plotted as a function of their concentration we call it a calibration or standard curve. Note that the points form a straight line.

The equation for the best fit line through the points is
y = 1.64 x - 0.002
Substituting the meaning of x and y into the equation tells us that:
absorbance = 1.64 * concentration - 0.002
To solve for the concentration of the dye in the unknown simply plug in the absorbance value:
0.39 = 1.64 * concentration - 0.002
and solve for the concentration. In this case it is equal to 0.24 M.

