Notice that the only experimental variable being changed is the concentration of the enzyme being used. The water is added to maintain a constant volume in all experiments.
Results
Using the data below prepare a graph with enzyme concentration as the independent variable (x-axis) and rate of O2 formation in mls/sec as the dependent variable (y-axis). From this graph describe the effect of enzyme concentration on rate of reaction.
| experiment # | enzyme solution (mls) | see results |
| 1 | 0.5 | 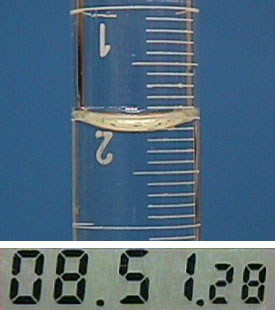
|
| 2 | 1.0 | 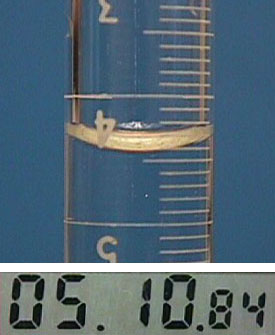
|
| 3 | 1.5 | 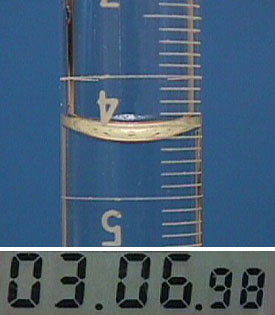
|
| 4 | 2.0 | 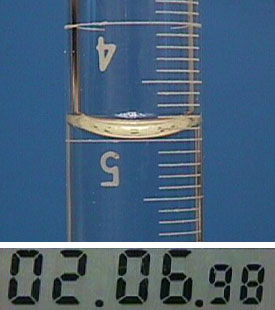
|